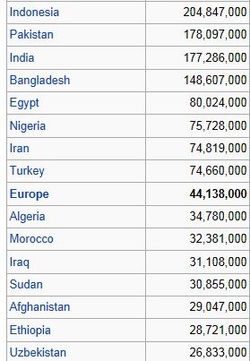
Take the above map and put it into ExplainEverything or Notability.
Then color in or mark the most Muslim Populated countries. (Any color you want)
Once you have completed that activity, go on line and attempt to find the Sunni vs. Shi'a population in each country.
Go back and on a new map and color red the countries that are mostly Sunni, then blue for the countries that are mostly Shi'a.
Finally take the data on Iran and create a pie chart demonstrating the population difference between the Sunni and Shi'a.
Repeat this for: Iraq, Syria, and Indonesia. We will compare your findings next class.
Please complete this assignment for homework. Don't forget to work on your study guide.
